Guide
Cash flow and reports
What cash flow measures, how it differs from net earnings, which accounts count as cash-based, and how to read the cash-flow report, projections, calendar, and timelines.
Bluecoins turns your transaction history into a set of reporting views, the best known of which is the cash-flow report: income versus expenses plotted over time, with the ability to drill down into the transactions behind any point on the timeline.
What cash flow measures
Cash flow measures the money moving into and out of your cash accounts over a period — the increase or decrease in cash (or cash equivalent). It is not a measure of profit. Anything that adds money to a cash account is a cash inflow; anything that takes money out is a cash outflow.
Typical inflows:
- Salary and other income paid into an account.
- Interest from savings accounts and dividends from investments.
- Selling an asset, such as a house or a car.
- Taking out a loan — a loan is a liability, but the money arriving in your account is still a cash inflow.
Typical outflows:
- Everyday spending from a cash-based account — wallet, savings, checking, and so on.
- Paying off a credit card.
- Buying an investment such as stocks or bonds.
Two consequences surprise people:
- Spending on a credit card is not a cash outflow at the time of purchase. The expense lands in your net earnings immediately, but the cash leaves your account only when you pay the card. Bluecoins follows the cash: card purchases are expenses in net earnings, and the card payment is the cash outflow.
- Moving money between two cash-based accounts is not cash flow in either direction. A transfer from checking to savings changes which account holds the money, not how much cash you have, so it is excluded from both inflow and outflow.
Cash flow vs net earnings
These two reports answer different questions, and they can disagree.
- Net earnings measures what you earned and spent in a period. It includes a credit-card purchase the moment it happens, and it includes non-cash events such as an expense that is recorded but not yet paid.
- Cash flow measures what actually moved in and out of your cash accounts in that period. It includes the card payment, not the card purchase.
So you can have money movement without income or expense — a transfer between your own accounts, or moving money into an investment. And you can have income or expense without cash movement — a card purchase not yet paid, or income invoiced but not yet received.
A worked example: if your income exceeds your expenses by only $50 this month, but a $50 bill is not payable until next month, your net earnings are tight while your cash flow for the month is $100 — and you can still cover an unplanned cost today.
Cash-flow setup
Which accounts count as cash is a choice, and you make it on the Cash Flow Setup screen. Open it from the Accounts screen with the Cash Flow Setup button at the top of the list, or from the cash-flow report’s chart tab, which has the same button.
The screen lists your asset accounts, grouped by type — checking, savings, wallet, investments, other assets, and any custom asset types you have created. Each account has a switch:
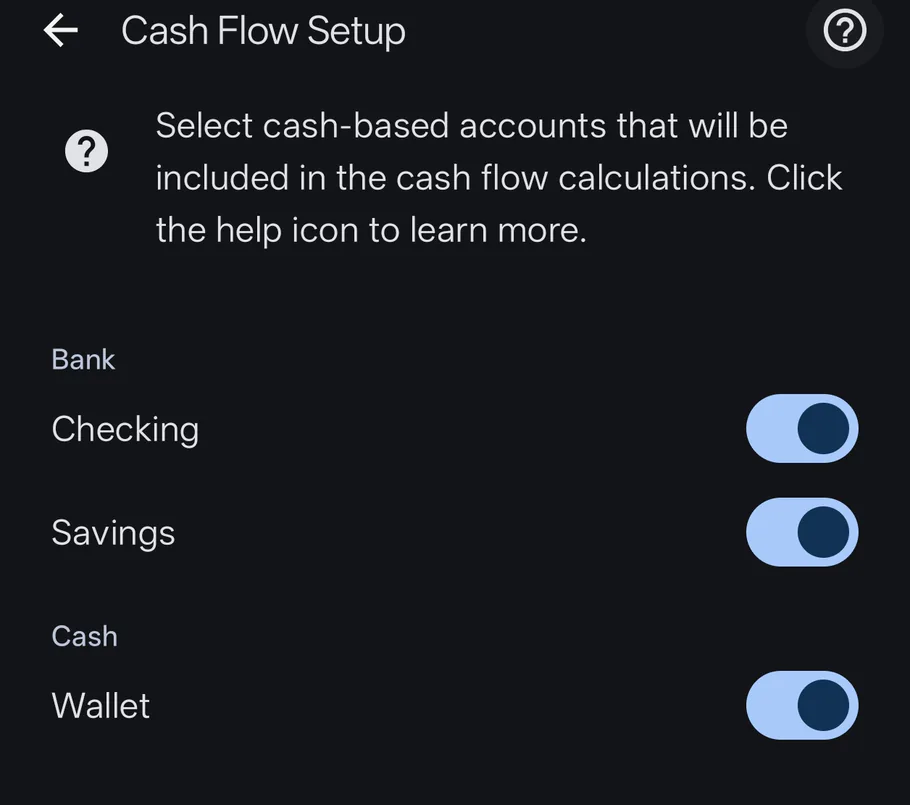
- On — the account is cash-based, and its transactions feed the cash-flow report.
- Off — the account is ignored by the cash-flow calculations.
The help text at the top of the screen summarizes it: Select cash-based accounts that will be included in the cash flow calculations. The help icon beside it opens this page.
Two things worth knowing:
- Only asset accounts appear. Liabilities such as credit cards and mortgages are never cash-based accounts. Paying a credit card is an outflow because the money leaves your cash account — not because the card is listed on this screen.
- Defaults for a new install. Checking, savings, and wallet start switched on; credit card and mortgage accounts start off. You can change any of them at any time.
This screen is the only place the cash-based setting lives — it is not part of the regular account setup screen.
The cash-flow report
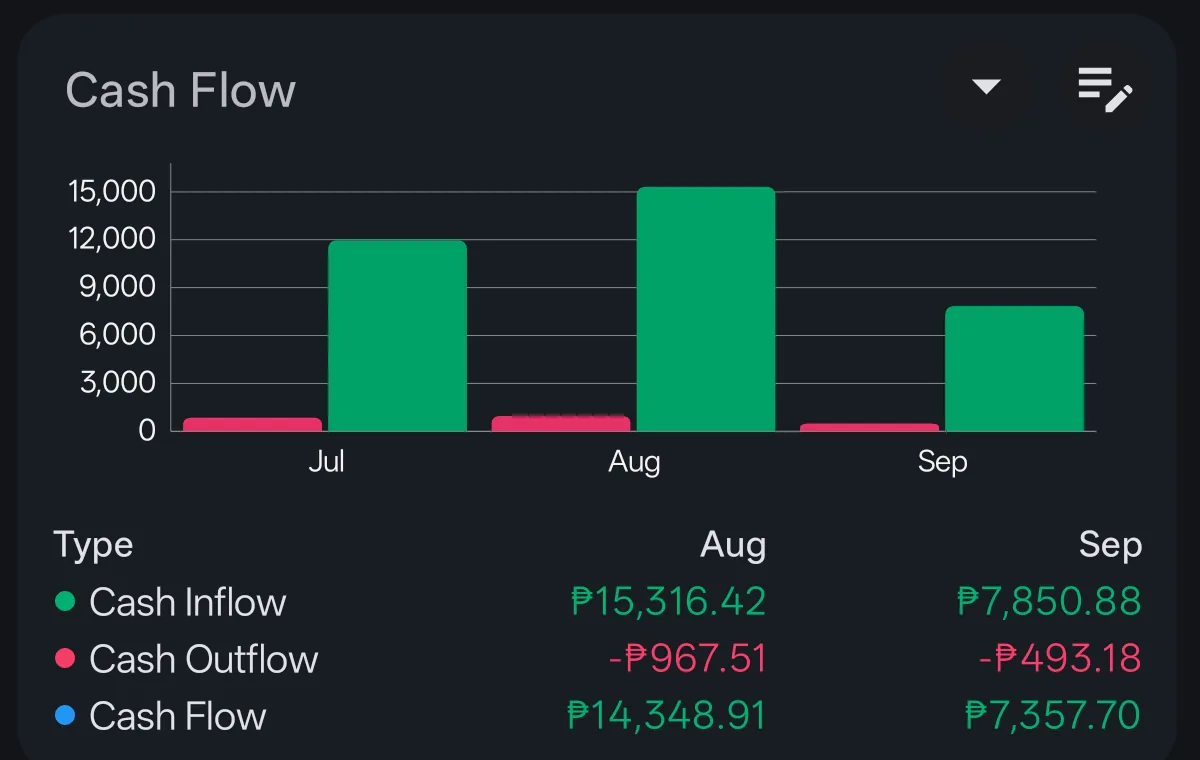
The cash-flow report answers “am I spending more than I make, and when?” It visualizes income and expense cash flow on a timeline, and each point can be opened to see the transactions that make it up — so a spike in spending is one tap away from the individual entries.
- Frequency — the timeline can be grouped daily, weekly, bi-weekly, monthly, quarterly, or annually.
- Chart type — switch between a bar chart and a line chart, whichever reads better for the period.
- Drill-down — tap a point on the chart, or a row in the table view, to open the cash-flow transaction list for that period. It splits into cash inflow and cash outflow sections, with the transactions behind each.
- Filters — accounts, categories, labels, and status can narrow the report further. Filtering by account narrows what is shown; it does not change which accounts are cash-based — that is the setup screen’s job.
The cash-flow card on the dashboard gives you the same summary at a glance — inflow, outflow, and net cash flow per period — and tapping it opens the full report.
Cash-flow projections
The report can look forward as well as back. Future Projection switches the period from a past range to the matching future one — last 3 months becomes next 3 months, and so on up to the longer ranges — and pulls in your scheduled reminders as well as any future-dated transactions. It is the same cash-flow calculation, pointed at what is coming: recurring bills, expected income, and transfers you have already scheduled. Projections work on the other time-based reports too, such as net worth and net earnings; see the reminders guide for how recurring transactions are set up.
Calendar report
The calendar report lays your transactions out on a monthly grid with daily totals, so you can see at a glance which days money moved and how much. It pairs the “when did I spend” question with the “what did I spend” detail of the transaction list.
Account timeline
Each account has its own timeline view: a running-balance chart over time for that account alone. It shows the shape of the balance — climbing, dipping, or flat — across the period you are looking at. For the full period-by-period reporting across all accounts and categories, see the timeline reports.
Transaction lists
Under the reports sit the date-grouped transaction lists with running balances, plus compact table views. These are the workhorses for day-to-day review: every entry in date order, with the balance after each row, filterable the same way the rest of the app filters.
Exporting reports
Any of the money, budget, expense, or income reports can be exported as PDF, Excel, HTML, or printed directly from the app — useful for sharing with an accountant, a partner, or your own records.
The picture as a whole
- Cash-flow report — income vs. expense timeline with drill-down, past or projected forward.
- Calendar report — monthly grid with daily totals.
- Account timeline — running-balance chart per account.
- Transaction lists — date-grouped entries with running balances.
Together with the balance sheet, these views cover the questions most people ask about their money: what I have (balance sheet), what I make and spend and when it reaches my accounts (cash flow), and when it happened (calendar and timelines). Every view is built from the same transactions you record in the transaction form, so the numbers can never disagree.